

Two minutes inside Mission Control.
Watch a real customer-journey decision flow through Perch, from anomaly to root cause to action.
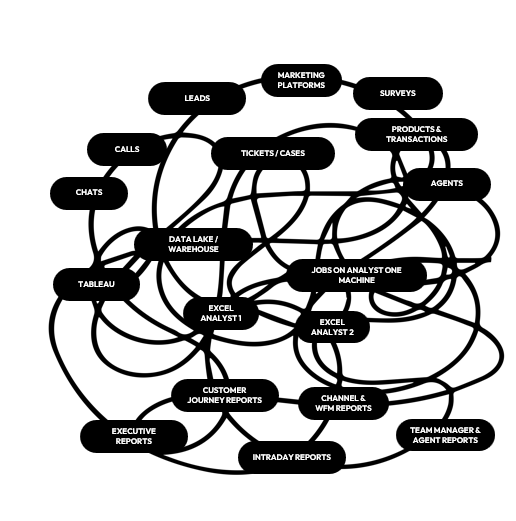
Messy Data. Missed Opportunities.
Most organizations run their customer journey across ten or more disconnected systems. Every report request spawns a one-off pipeline. No two analysts build it the same way, and no one can maintain what someone else built. When a source system changes, the pipeline breaks and the data goes stale.
The deeper problem is trust. The same metric calculated in three places produces three different answers. Every meeting starts with a data debate before anyone gets to the actual decision. Leaders stop relying on the numbers because the numbers have let them down before.
The result is a business that is always one analyst departure away from flying blind. The knowledge lives in people, not the platform. When they leave, everything they learned about the business leaves with them.
Perch was built for exactly this problem.
Same data. Different results.
Always Analyzing.
Perch is always running in the background. Every minute, every metric, every cohort. The platform watches the operation continuously so your team does not have to.
When something moves, Perch traces it back through every contributing input. Routing changes, agent cohorts, campaigns, SKUs, time of day. The cause arrives with the alert.
You walk into the standup with the answer already on the table. The conversation moves to action.


Always There to Answer.
Ask any question, in plain language, and get the answer in seconds. Not a chart. The answer.
Perch reasons over your full operation. It cites the evidence, ranks the contributing causes, and shows you exactly where the numbers came from.
No SQL. No ticket to BI. No waiting until next Tuesday.

The numbers make the argument.
The full stack behind every AI Agent.
Your data, your business, your journey wired in.
Six purpose-built layers: a unified data model, a semantic layer, a continuously-updating context manager, the Guide AI, a dedicated services pod, and an open API. Together they make every Perch Agent domain-specific, business-specific, and customer-journey-specific from day one.